Atals-Based Native PET analysis
The analysis relies on the CL processing presented previously here.
This native PET space analysis may use all the available MNI space atlases after transforming them to the PET space using the CL transformations.
Performing Analysis In The Native PET Space
The raw (unmodified) PET image is analysed without any transformation or filtering applied to the image. The output of this native analysis is stored in the native folder as shown below.
    # output for native PET analysis
    onat = outpath/'native'

    # > reference PET (explicitly identifying it from CL processing input)
    fpetin = out_cl['petc']['fim']

    # > get PET Numpy array
    pet = nimpa.getnii(fpetin)

    # > save the atlases and grey/white matter masks in the dictionary of native PET output
    natdct = amypet.atl2pet(hmr['fatlas_full'], out_cl, fpet=fpetin, outpath=onat)
The above natdct dictionary contains the file paths and images for the grey and white matter probabilistic masks as well as the atlas in the native PET space.
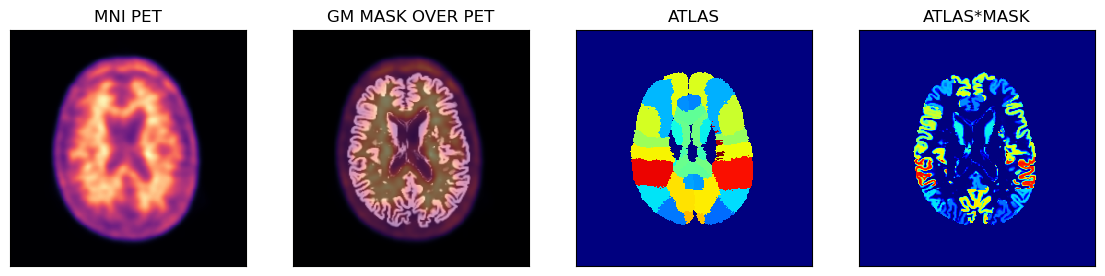
The native PET slices and registered masks and atlases are shown below using the Hammers atlas:
# > plot the images
fig,axs = plt.subplots(1,4, figsize=(14, 8))
axs[0].matshow(pet[40,...], cmap='magma')
axs[1].matshow(pet[40,...], cmap='magma')
axs[1].imshow(natdct['gmpet'][40,...], cmap='gray', alpha=0.5)
axs[2].matshow(natdct['atlpet'][40,...], cmap='jet')
axs[3].matshow(natdct['atlpet'][40,...]*natdct['gmpet'][40,...], cmap='jet')

# > remove ticks
for i in range(4):
    axs[i].axes.get_xaxis().set_ticks([])
    axs[i].axes.get_yaxis().set_ticks([])

axs[0].set_title('MNI PET')
axs[1].set_title('GM MASK')
axs[2].set_title('ATLAS')
axs[3].set_title('ATLAS*MASK');

The Problem of Native PET Space Image Resolution
Native and raw PET images usually exhibit low resolution compared to structural images from other modalities such as MRI or CT. As it can be observed in the images above, the low PET resolution, and consequently larger voxel size of PET images relative to the MRI T1w images, makes the sampling masks in native PET space coarse and inaccurate.
Hence, we have developed a way of trimming and upscaling PET images with minimal or none modifications, just in order to facilitate higher resolution grid representing PET images and allowing more refined and accurate sampling of PET images.
Upsampling PET to Higher Resolution Grid
The PET image can be upsampled to higher resolution grid without any extra modifications (apart from interpolation if chosen) in order to obtain higher sampling accuracy from the structural information provided by the T1w MRI images and their derivates (segmentations, etc.).
Upsampling With and Without Interpolation
Below is shown the Python code to trim and upscale the PET image to roughly the same voxel size as the MRI using nimpa.imtrimup command. The upscaling is governed by the scale parameter, which in this case is 2 to bring the voxel size from approximately 2 mm to 1 mm isotropically.
The interpolation is controlled by the int_order parameter, which is 1 meaning that trilinear interpolation is used. If int_order = 0, no actual interpolation is used resulting in True-Voxel or Native-Voxel upsampling in which the same voxel values are preserved by many more smaller voxels, thus avoiding any interpolation effects if desired so.
    # > upscale and trim the original PET and use linear interpolation (if no interpolation is desired then use int_order=0)
    imupd = nimpa.imtrimup(fpetin, scale=2, int_order=1, store_img=True)

    # > get the upscaled PET space atlas and probability GM/WM masks
    natupdct = amypet.atl2pet(hmr['fatlas_full'], out_cl, fpet=imupd['fim'], outpath=onat)
The upscaled images and sampling masks are shown below.
# > plot the images
fig,axs = plt.subplots(1,4, figsize=(14, 8))
axs[0].matshow(imupd['im'][80,...], cmap='magma')
axs[1].matshow(imupd['im'][80,...], cmap='magma')
axs[1].imshow(natupdct['gmpet'][80,...], cmap='gray', alpha=0.5)
axs[2].matshow(natupdct['atlpet'][80,...], cmap='jet')
axs[3].matshow(natupdct['atlpet'][80,...]*natupdct['gmpet'][80,...], cmap='jet')
# > remove ticks
for i in range(4):
    axs[i].axes.get_xaxis().set_ticks([])
    axs[i].axes.get_yaxis().set_ticks([])

axs[0].set_title('MNI PET')
axs[1].set_title('GM MASK OVER PET')
axs[2].set_title('ATLAS')
axs[3].set_title('ATLAS*MASK');